


From the Wikipedia article on continuous probability distribution aka “normal distribution“:
In probability theory, the normal (or Gaussian) distribution is a very common continuous probability distribution. Normal distributions are important in statistics and are often used in the natural and social sciences to represent real-valued random variables whose distributions are not known.[1][2]
The normal distribution is useful because of the central limit theorem. In its most general form, under some conditions (which include finite variance), it states that averages of random variables independently drawn from independent distributions converge in distribution to the normal, that is, become normally distributed when the number of random variables is sufficiently large. Physical quantities that are expected to be the sum of many independent processes (such as measurement errors) often have distributions that are nearly normal.[3] Moreover, many results and methods (such as propagation of uncertainty and least squares parameter fitting) can be derived analytically in explicit form when the relevant variables are normally distributed.
The normal distribution is sometimes informally called the bell curve. However, many other distributions are bell-shaped (such as the Cauchy, Student’s t, and logistic distributions). Even the term Gaussian bell curve is ambiguous because it may be used to refer to a some function defined in terms of the Gaussian function which is not a probability distribution because it is not normalized in that it does not integrate to 1.
The probability density of the normal distribution is:
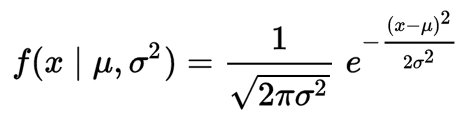
Where:
μ is mean or expectation of the distribution (and also its median and mode). σ is standard deviation σ² is variance
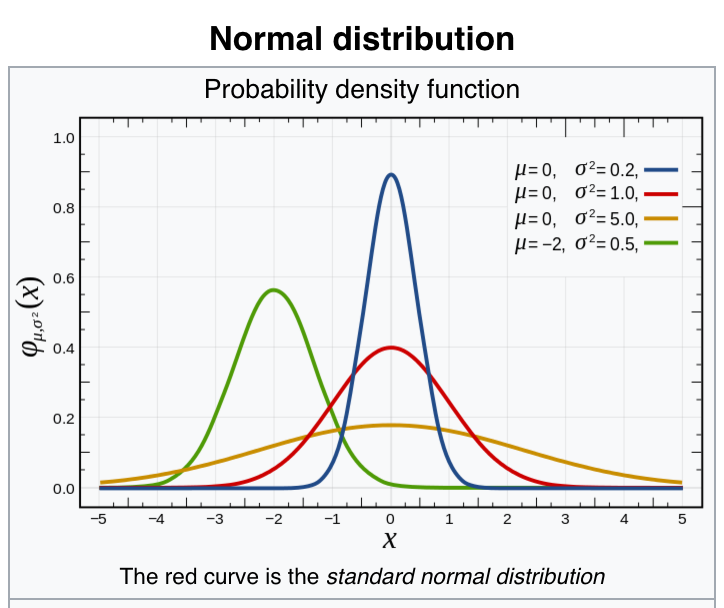
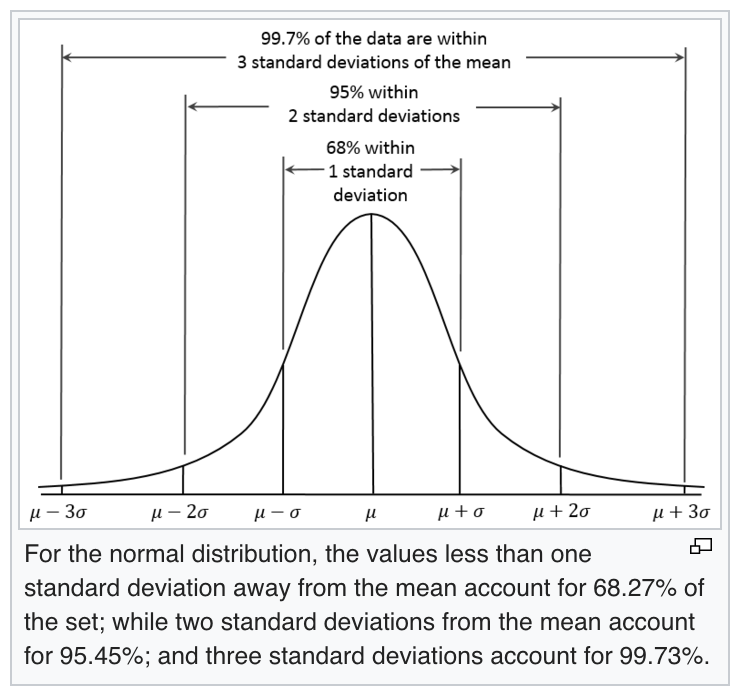
Here are some pretty graphs from the same Wikipedia article:
Read and see more here.